Shelf Life: Introduction to Water Activity
Shelf Life: Introduction to Water Activity
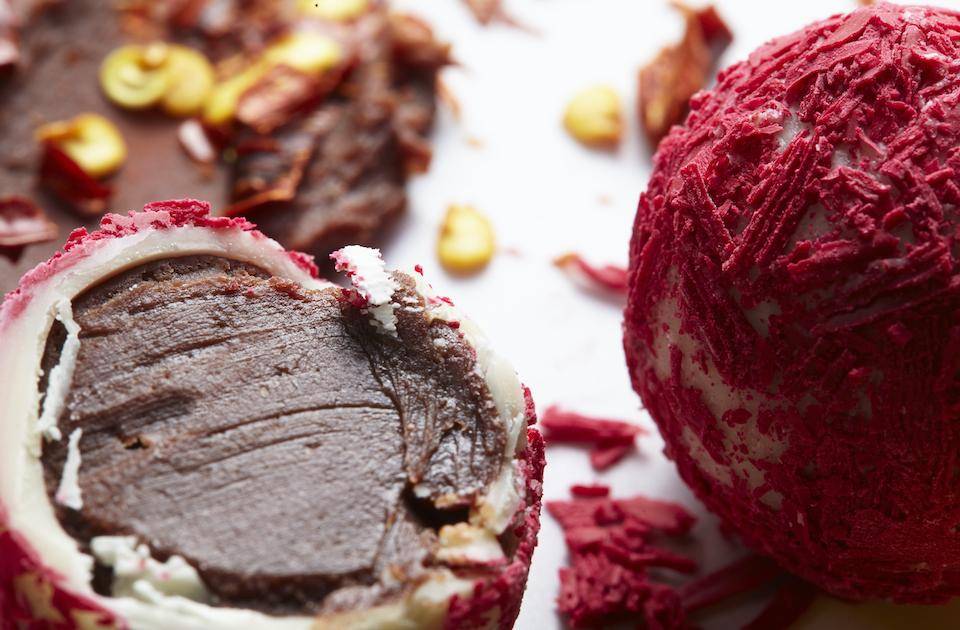
This fifth article in our shelf life guide will offer a concise introduction to the concept of water activity (AW) as it relates to shelf life. Subsequent articles will explore how AW is measured and best practices that will extend the shelf life of your products.
Whether you are a cottage chocolatier just getting started or a successful shop owner ready to start shipping your products or selling them wholesale, the shelf life of your products is an important consideration when creating your business plan, planning a product assortment, and thinking about future goals. Whether your ganache lasts for just a few days or is shelf-stable for months is, in part, a question of water activity (AW).
Previous Article

What is Water Activity (AW)
Water Activity is a measurement of bound vs free water
- It indicates how much water is available in a food product for all manner of reactions:
FREE WATER = ACTIVE WATER - Aw is a better measure of the risk of spoilage than the water content itself.
- The Aw value is an abstract number and is always greater than 0 and less than 1.
- Aw is measured at the temperature at which the product is distributed and sold (20°C).
The AW value is expressed on a scale from 0 to 1: - 0 = completely dry mass or solid ingredients
- 0.5 stands for a solution corresponding to the activity of 50% free water
- 1 = 100% water
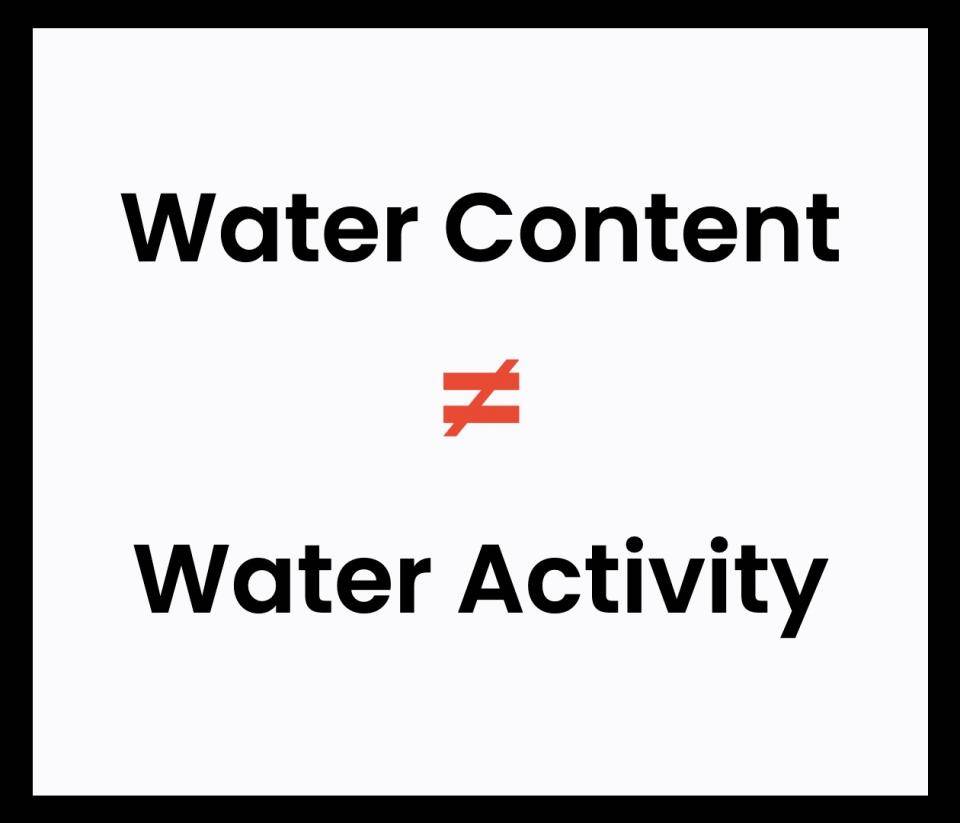
Do Not Confuse Moisture Content with Water Activity
As we saw in the previous article, two recipes with the same moisture content can have different water activity levels depending on the amount and water-absorbing power of the ingredients used.
Water content = Total amount of water
- free water + water fixed by other components
Water activity = The free water in a product
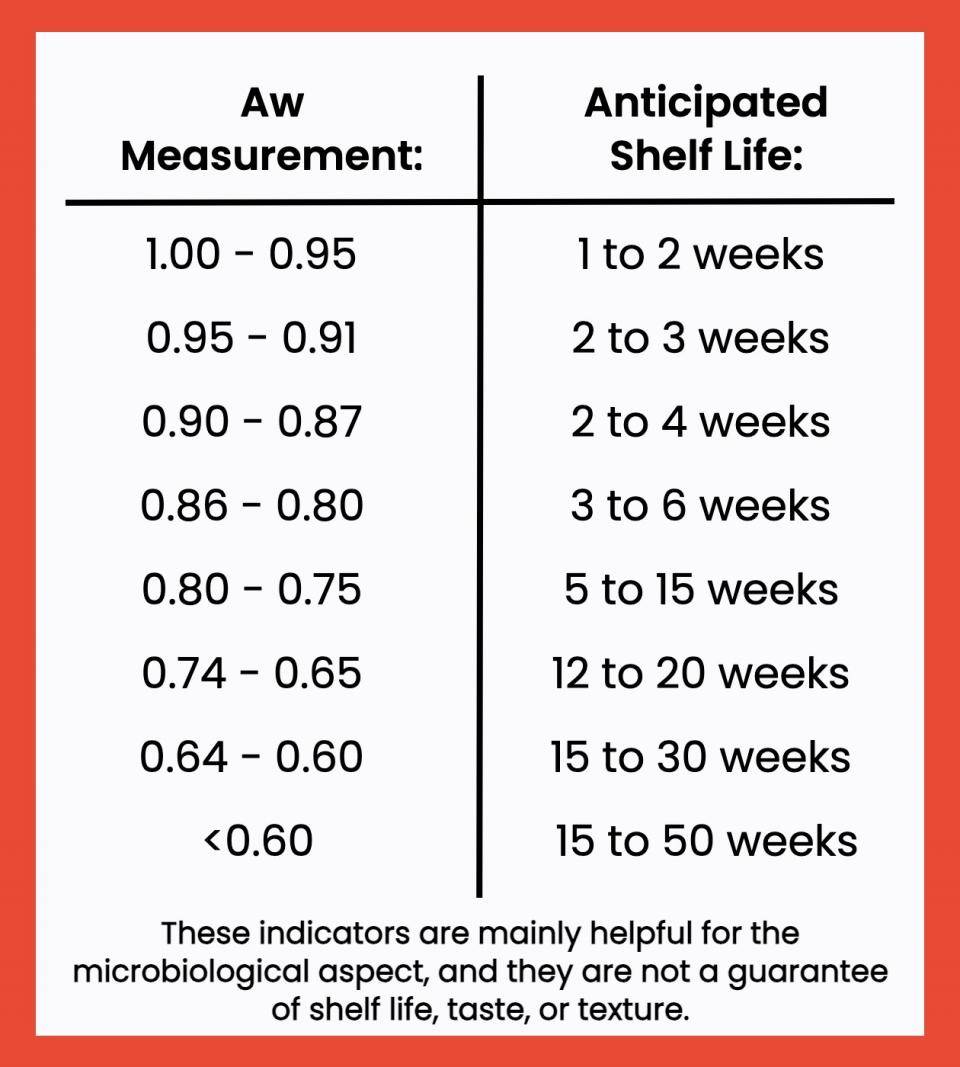
An Overview of Water Activity
The following table lists the average water content for some common ingredients.
| Product | Water Content |
Aw |
| Milk | 88% | .993 - .995 |
| Dry Milk Powder | 2 - 4% | .100 - .300 |
| Butter (unsalted) | 16% | >.970 |
| Butter (salted) | 14% |
.910 - .940 |
| Evaporated Milk | 73% | .980 - .990 |
| Condensed Milk | 27% | .770 - .850 |
| Glucose Syrup | 20% | .680 - .720 |
These values are a general guideline. It is impossible to know these values without scientifically verified data, and, as much as manufacturers strive for consistency, variations do occur.
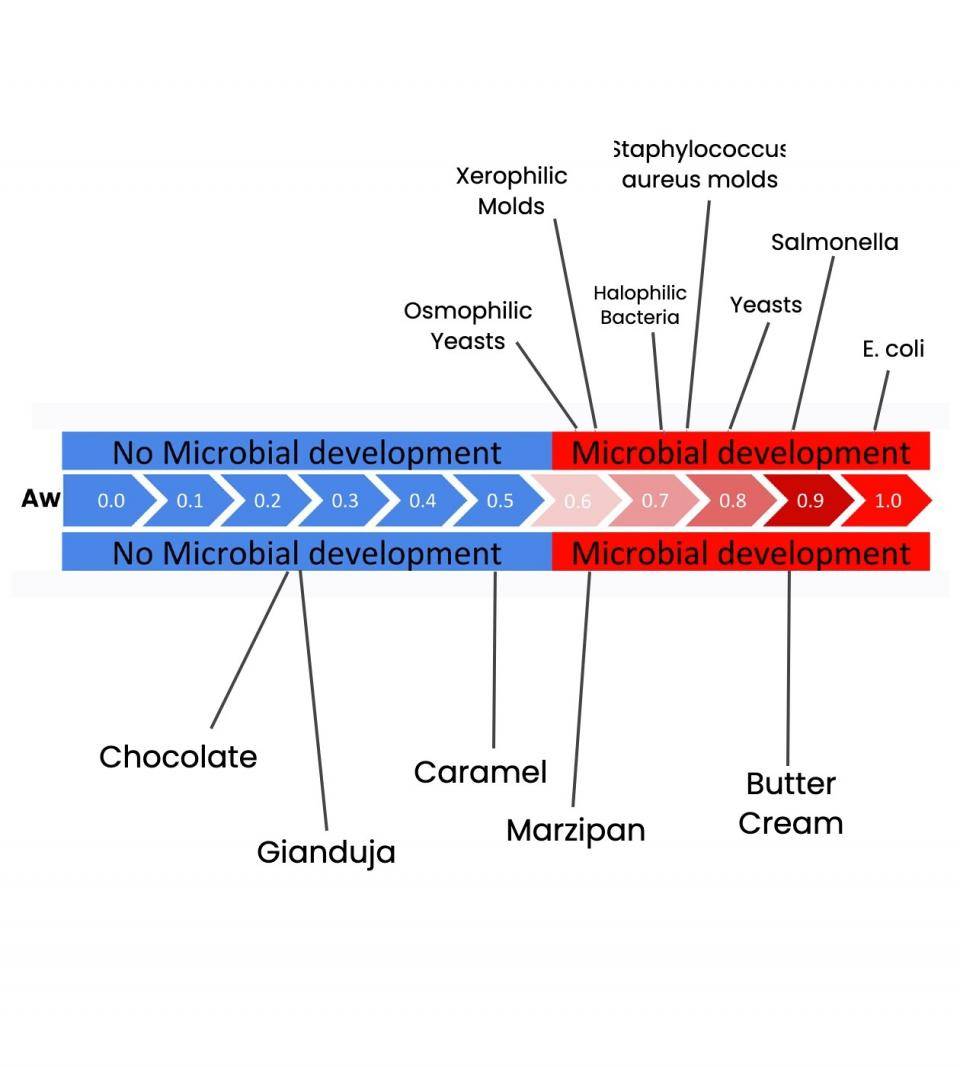
Aw Ranges: Common Products and the Development of Microorganisms.
To help you better understand the meaning and consequences of free water, this chart places different products on a scale of water activity according to where the average product would fall; on the right-hand end of the scale, we see the Aw levels that encourage various microorganisms.
In an example from the previous article, we looked at two ganaches with identical moisture contents. However, one had an Aw of .750, the other an Aw of .900. Note the significantly higher amount of microbial activity that could occur in the second ganache vs the first - all due to free water.
More Chef's Reads Articles to Help You Succeed
Related Technique Tutorials
Ready to get started?
Let us help you choose the right ingredients for your next project.

